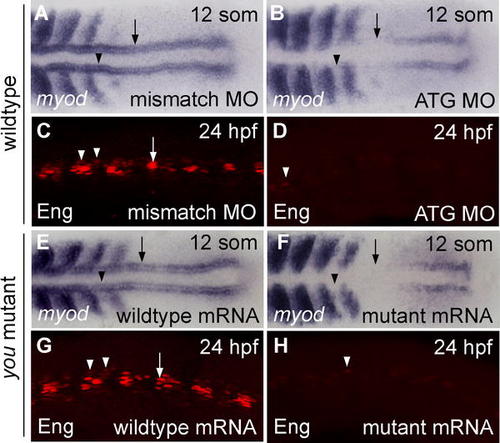
MO-Induced Phenocopy of you Defects and Rescue of the you Phenotype with mRNA Injection. (A, B, E, and F) Dorsal view of the posterior trunk and tail bud of 12-somite embryos. (C, D, G, and H) Lateral views of somites 8–13 in whole-mount embryos at 24 hpf. Anterior is to the left in all images. Injection at the 1–4-cell stage of 420 pg of a MO targeting the translational start site of the you mRNA (ATG MO) resulted in decreased adaxial expression of myod in the somitic (arrowhead) and presomitic (arrow) mesoderm of wild-type embryos (B). Injection of an equivalent amount of a mismatch control (mismatch MO) did not produce these defects (A). Similarly, wild-type embryos injected with 420 pg of the mismatch MO (C) exhibited strong Engrailed expression in muscle pioneers (arrow) and weaker expression in medial fast fibers (arrowheads). In contrast, Engrailed expression was strongly reduced in wild-type embryos injected with 420 pg of the ATG MO (D), though very weak expression was still observed (arrowhead). Genotypically you mutant embryos (E) showed rescued expression of adaxial myod in somitic (arrowhead) and presomitic (arrow) mesoderm when injected with 50 pg of synthetic you mRNA at the 1–4-cell stage, while mutants injected with 50 pg of a frameshift mutant form of you mRNA (F) did not exhibit rescue of adaxial myod expression. At 24 hpf, genotypically you mutant embryos injected at the 1–4-cell stage with 50 pg of you mRNA (G) showed rescue of strong Engrailed expression in the muscle pioneers (arrow) and weaker expression in the medial fast fibers (arrowheads). Mutant embryos injected with 50 pg of the mutant mRNA (H) did not show rescued Engrailed expression, though very weak Engrailed expression (arrowhead) was observed in some cases. Engrailed expression at the MHB was normal in all analyzed embryos (data not shown). Genotypes of embryos shown in (E–H) were determined by PCR after photography.
|
