
Fig. 6
- ID
- ZDB-FIG-050209-7
- Publication
- Karlstrom et al., 2003 - Genetic analysis of zebrafish gli1 and gli2 reveals divergent requirements for gli genes in vertebrate development
- Other Figures
- All Figure Page
- Back to All Figure Page
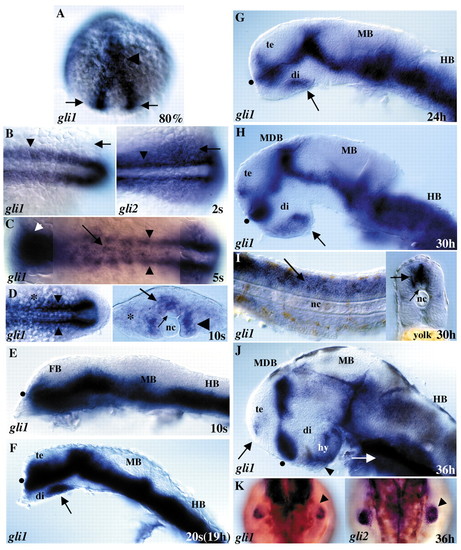
Developmental expression of zebrafish gli1. (A) 80% epiboly. Transcripts for gli1 are first detected in the anterior neural plate (arrowhead) and in pre-somitic mesoderm (arrows). (B) 2-somite stage. In the trunk, both gli1 (left panel) and gli2 (right panel) are expressed in adaxial cells (arrowheads) adjacent to the notochord. gli1, like gli2, is also expressed in paraxial mesoderm, with gli2 expression extending more laterally (arrows). (C) 5-somite stage. gli1 is expressed throughout the anterior neural plate (white arrowhead), in adaxial cells that give rise to slow muscle fibers (black arrowheads), as well as in the tailbud (out of focus). Some patchy expression is present in the developing spinal cord (arrow). (D) 10-somite stage, dorsal view (left) and cross section (right) of the trunk. gli1 expression continues in adaxial cells (arrowheads) and spreads laterally into developing somites (asterisk). gli1 is expressed ventrally in the spinal cord (larger arrow) but not in floor plate cells adjacent to the notochord (smaller arrow). (E-J) Lateral views of the brain, eyes have been removed. (E) 10-somite stage. gli1 is expressed throughout the ventral forebrain, midbrain, hindbrain, and spinal cord (not shown). (F) 20-somite stage. In the brain, gli1 is expressed in ventral regions in a pattern similar to that of ptc1 (see Fig. 3). In the forebrain, gli1 is primarily expressed in the diencephalon, but expression also extends into the ventral telencephalon dorsal to the optic recess (black dot). Expression is now absent in the ventral-most diencephalon, with the exception of a large patch in the posterior part of the developing hypothalamus (arrow). (G,H) 24 hours and 30 hours. gli1 expression continues in the ventral CNS, including in the pre- and postoptic areas on either side of the optic recess (black dot) and in the patch in the posterior hypothalamus (arrow). (I) Expression in the trunk at 30 hours. gli1 is strongly expressed in the spinal cord (arrows) and is more weakly expressed in somites. Cross section through trunk (right) shows spinal cord gli1 expression (larger arrow) is absent from dorsal cells and ventral floor plate cells (smaller arrow). (J) 36 hours. By 36 hours, gli1 is expressed predominantly along the diencephalon/telencephalon border and in the ventral hypothalamus, including the region of the anterior pituitary anlage (arrowhead). gli1 is also expressed in a small patch in the telencephalon (arrow) and in endoderm (white arrow). (K) Expression in the fin bud at 36 hours. Both gli1 (left) and gli2 (right) are expressed in the pectoral fin buds (arrowheads). gli1 expression is more limited than gli2, being predominantly in the posterior and distal mesenchyme, while gli2 is expressed throughout the fin mesenchyme (compare arrowheads). (A-D) and (K) are dorsal views, (E-J) are lateral views. Anterior is to the left in all panels except (A) and (K), where anterior is up. di; diencephalon, FB; forebrain, HB; hindbrain, hy; hypothalamus, MB; midbrain, MDB; mid-diencephalon boundary, MHB; midbrain-hindbrain boundary, nc; notochord, te; telencephalon.
|